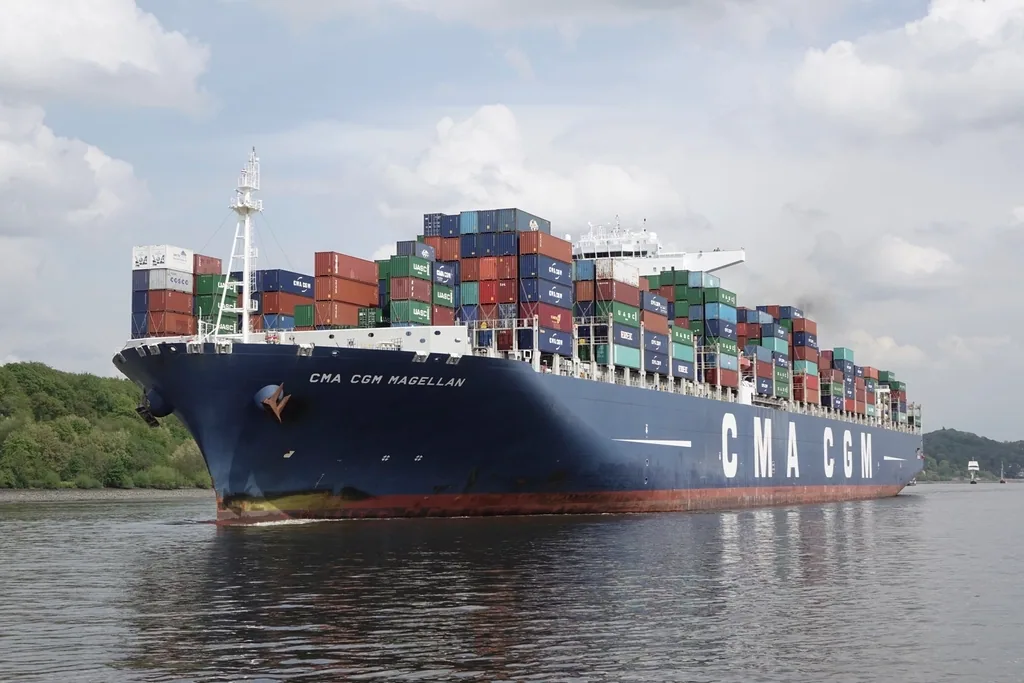
Shipping Powerhouses Raise Rates Despite China Slowdown
When China’s economy weakens, the global shipping market typically contracts as well. This year is different. As exports decline, paradoxically, the supply control capacity of strong carriers becomes more pronounced, and it is reversing rates. Demand weakness originating from China is reshaping the industry’s landscape.
Shipping Industry’s Supply-Demand Imbalance
Global shipping is a cyclical industry. When business was good, excess orders for ships were placed. Those vessels are now being delivered in 2023-2025, intensifying oversupply. With China’s export momentum weakening now, this excess supply is starkly apparent. Major ship types like Capesize bulk carriers continue to see supply outpacing demand.
Yet supply control is emerging. Some major carriers are closing unprofitable routes or operating at reduced speeds, cutting effective supply and entering a rate recovery phase. This is not merely price rebound but industry structural divergence between winners and losers.
Why Carriers Are Moving Now: Four Factors
1. Long-term slowdown in China’s export growth rate: China is a major source of demand for the global shipping market. Recent Chinese stimulus measures have been limited and structural growth rate deceleration persists, significantly cooling container export growth compared to 2024. This increases idle vessel numbers and pressures carrier decisions.
2. Strong players’ strategic supply withdrawal: DAC (Danaos) closed at $158.34 on October 23, 2026, maintaining a net profit margin of 51.3%. This is more than double the industry average, indicating DAC’s large fleet holdings and superior contract portfolio give it far stronger negotiating power than competitors. When such carriers proactively close unprofitable routes or shift to slow-steaming operations, market supply becomes constrained.
3. Accelerated ship scrapping from aging fleet: Ships built in the early 2010s are entering full scrapping phase. With asset values depressed amid China’s shipping weakness, some small carriers are moving older, low-profitability ships to scrapping. This is macroeconomic supply reduction.
4. Asymmetric recovery between container and bulk segments: MATX (Matson), specialized in Pacific routes, closed at $228.64 on October 23, 2026, recording revenue growth of 16.7%. U.S.-Asia trade is less affected by China-origin demand weakness, and supply control on that route is progressing faster. Meanwhile, ZIM (ZIM Integrated Shipping), an Israel-based international container carrier, closed at $29.35 on October 23, 2026, but shows a net profit margin of only 2.1%, making profitability recovery sluggish.
Why the Gap Between Strong and Weak Players Widens
Ship efficiency costs and scale: DAC, with a market cap of $2.9B, holds large period charter deals and new ship options, and with a 51.3% net profit margin can take the lead in supply control. Meanwhile, SB (Safe Bulkers), a bulk ship specialist, closed at $8.09 (October 23, 2026) with a net profit margin of 28.3% and revenue growth of 33.0%, showing less financial flexibility but higher revenue growth rates. However, with a market cap of just $921M, it faces constraints on large-scale route closures.
PER and market expectations: DAC’s PER of 5.4 is well below the industry average of 15-25, meaning the market has already priced in cyclical recovery. ZIM’s PER of 25.5, in contrast, reflects market sentiment expecting profitability recovery. As supply control proceeds, profitability gaps are likely to widen further.
Summary
Downward pressure on the global shipping market from China’s export weakness is clear. Yet within it, strong carriers’ supply strategies are favorably restructuring rate dynamics. The supply cycle adjustment phase signals recovery centered on stronger carriers and enables exit of weaker ones. In this process, individual carrier financial capacity and contract portfolio will greatly determine future profitability.
This article is for information only and is not investment advice.